Agent run visualizerSandbox, from sourcesucceeded

Open-source real-time visualizer for coding agent sessions: agent graph on a canvas, timeline, transcript, file attention and cost overlay. Run from its repository in the DeepQA sandbox.

Tested byDeepQA Teamfrompatoles/agent-flowat 84cd2fbonSep 20, 2026

Run #1model gemini-balanced (vertex)took 6m

11 of 12 scenarios passed, 1 failed, no issues after the audit.

Share on X
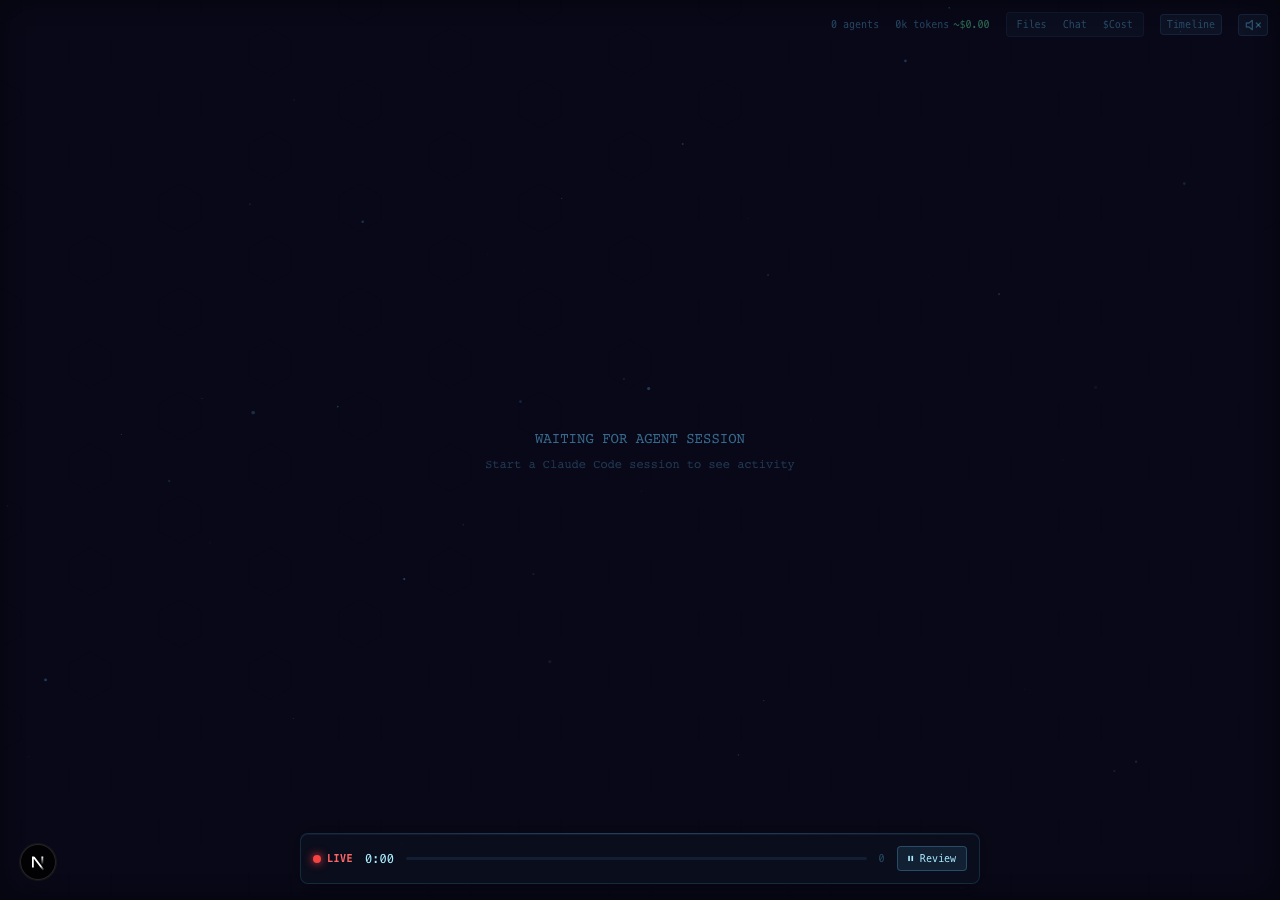
patoles/agent-flow in the browser during the run

By the numbers

11 of 12
scenarios passed, 1 failed
130
browser actions
40
screenshots
139
model calls
5.4
minutes
12
scenarios
11
passed
1
failed
0
blocked
0
issues

Walkthrough

Every scenario DeepQA drove in the browser, in plan order, with the 36 screenshots it captured along the way. A passing scenario is evidence too.

  1. S1
    Initial load and waiting state

    2 steps, 1 screenshot

    pass
    S1-2.png
    S1 · Initial load and waiting state
    • The initial dashboard loaded cleanly displaying 'WAITING FOR AGENT SESSION', 'Start a Claude Code session to see activity', and zeroed counters (0 agents, 0k tokens, ~$ 0.00).
    • Dashboard successfully rendered the waiting state with all metrics initialized to zero.
  2. S2
    Review mode toggle

    4 steps, 3 screenshots

    pass
    S2-1.png
    S2 · Review mode toggle
    S2-3.png
    S2 · Review mode toggle
    S2-5.png
    S2 · Review mode toggle
    • Clicked '⏸ Review' button; playback controls (play/pause button, speed multipliers 0.5x-4x, replay button, and '▶ LIVE' button) appeared.
    • Clicked '▶ LIVE' button; playback controls disappeared and the application returned to Live mode showing the '⏸ Review' button.
    • Navigated to http://localhost:3000/ and verified initial live state.
    • Review mode and Live mode toggle properly with full playback controls appearing and disappearing as expected.
  3. S3
    Chat transcript panel toggle

    4 steps, 3 screenshots

    pass
    S3-1.png
    S3 · Chat transcript panel toggle
    S3-3.png
    S3 · Chat transcript panel toggle
    S3-5.png
    S3 · Chat transcript panel toggle
    • Opened the Chat transcript panel, displaying TRANSCRIPT header, message count, search button, and close button.
    • Clicked the close button and confirmed the Chat transcript panel was completely dismissed from the view.
    • The Chat transcript panel successfully toggles open when clicking the Chat dock button and closes cleanly when clicking the close (✕) button.
  4. S4
    Files panel toggle

    4 steps, 3 screenshots

    pass
    S4-1.png
    S4 · Files panel toggle
    S4-3.png
    S4 · Files panel toggle
    S4-5.png
    S4 · Files panel toggle
    • Clicked the Files button; the FILE ATTENTION panel opened displaying 'No files accessed yet' with a close button (✕).
    • Clicked the '✕' close button; the FILE ATTENTION panel dismissed cleanly.
    • The Files button in the bottom dock opens the 'FILE ATTENTION' panel showing file metrics/empty state.
    • Clicking the '✕' close button successfully dismisses the files panel back to the default view.
  5. S5
    Timeline panel toggle

    4 steps, 3 screenshots

    pass
    S5-1.png
    S5 · Timeline panel toggle
    S5-4.png
    S5 · Timeline panel toggle
    S5-6.png
    S5 · Timeline panel toggle
    • Clicked Timeline button; Execution Timeline panel opened displaying the execution state legend (Idle, Thinking, Tool Call, Error, Complete).
    • Clicked the '✕' close button on the Execution Timeline panel; the panel dismissed properly.
    • Navigated to http://localhost:3000/ and observed the initial dashboard state.
    • Clicked 'Timeline' button on the dock, which rendered the 'EXECUTION TIMELINE' panel with state legends for Idle, Thinking, Tool Call, Error, and Complete.
    • Clicked the '✕' button on the Execution Timeline panel, successfully closing and dismissing the panel.
  6. S6
    Playback speed selection

    4 steps, 4 screenshots

    pass
    S6-1.png
    S6 · Playback speed selection
    S6-3.png
    S6 · Playback speed selection
    S6-5.png
    S6 · Playback speed selection
    S6-7.png
    S6 · Playback speed selection
    • Clicked Review button to enter playback review mode, displaying speed options (0.5x, 1x, 2x, 4x) and playback controls.
    • Selected 0.5x playback speed button without error.
    • Selected 4x playback speed button without error.
    • Entered review mode and successfully selected 0.5x and 4x playback speed buttons.
    • The application accepted playback speed changes without errors or crashes.
  7. S7
    Chat transcript search toggle

    3 steps, 3 screenshots

    pass
    S7-1.png
    S7 · Chat transcript search toggle
    S7-3.png
    S7 · Chat transcript search toggle
    S7-7.png
    S7 · Chat transcript search toggle
    • Loaded the home page with bottom dock showing Files, Chat, $Cost, and Timeline buttons.
    • Opened the Chat transcript panel showing 'TRANSCRIPT', '0 messages', search toggle button '/', and close button.
    • Clicked the search toggle button '/' and verified that the 'Filter messages...' input field appeared and accepted text entry ('test query').
    • The Chat button opened the transcript side panel.
    • Clicking the '/' search toggle button made the 'Filter messages...' input field visible.
    • Entering text into the search input field worked correctly and updated the transcript filter state.
  8. S8
    Chat transcript filtering with text

    4 steps, 4 screenshots

    pass
    S8-1.png
    S8 · Chat transcript filtering with text
    S8-3.png
    S8 · Chat transcript filtering with text
    S8-5.png
    S8 · Chat transcript filtering with text
    S8-8.png
    S8 · Chat transcript filtering with text
    • Opened the Chat transcript panel showing 0 messages and search toggle button.
    • Clicked the search toggle button which displayed the 'Filter messages...' textbox.
    • Typed 'hello' into the filter input and verified the panel updated to '0/0 messages' with empty state 'No matching messages' without errors.
    • The Chat button opens the transcript panel displaying 0 messages and waiting state.
    • The '/' search toggle button displays the filter messages text input.
    • Typing 'hello' into the filter input smoothly updates the count to '0/0 messages' and displays 'No matching messages' without crashing or erroring.
  9. S9
    Chat transcript filtering with whitespace

    4 steps, 4 screenshots

    pass
    S9-1.png
    S9 · Chat transcript filtering with whitespace
    S9-4.png
    S9 · Chat transcript filtering with whitespace
    S9-6.png
    S9 · Chat transcript filtering with whitespace
    S9-9.png
    S9 · Chat transcript filtering with whitespace
    • Opened the Chat panel displaying the transcript header and search toggle.
    • Entered whitespace into the chat filter input; application remained responsive and showed No matching messages without crashing.
    • The chat transcript filter input accepts whitespace characters cleanly without crashing or throwing unhandled errors.
    • The UI updates gracefully to show message count and empty results state.
  10. S10
    Cost metrics toggle

    3 steps, 3 screenshots

    fail
    S10-2.png
    S10 · Cost metrics toggle
    S10-11.png
    S10 · Cost metrics toggle
    S10-13.png
    S10 · Cost metrics toggle
    • On initial load at http://localhost:3000/, the cost metrics displaying '0k tokens' and '~$ 0.00' are visible in the top bar.
    • Clicking the '$Cost' button in the bottom dock produced no state change, drawer opening, or change in the visibility of the token/cost metric display.
    • Navigated to http://localhost:3000/ and verified that token and cost metrics ('0k tokens', '~$ 0.00') were visible in the interface.
    • Verified that other dock buttons ('Files', 'Chat', 'Timeline') open and close their respective panels.
    • Clicked the '$Cost' button in the bottom dock multiple times and observed that it triggered no UI action, panel, or change in metric visibility.
  11. S11
    Panel switching handling

    3 steps, 4 screenshots

    pass
    S11-1.png
    S11 · Panel switching handling
    S11-3.png
    S11 · Panel switching handling
    S11-5.png
    S11 · Panel switching handling
    S11-7.png
    S11 · Panel switching handling
    • Clicked Chat button in dock, opening the transcript/chat panel with title TRANSCRIPT and close button.
    • Clicked Files button in dock, cleanly replacing the Chat panel with the FILE ATTENTION panel without overlaps or UI corruption.
    • Switched back to Chat panel smoothly; transcript panel rendered cleanly.
    • Panel switching transitions seamlessly between Chat (TRANSCRIPT) and Files (FILE ATTENTION) without UI corruption or freezes.
  12. S12
    Load integrity and 404 resilience

    2 steps, 1 screenshot

    pass
    S12-3.png
    S12 · Load integrity and 404 resilience
    • Navigated to http://localhost:3000/ and verified that the waiting message, status header, stats indicators, and bottom dock navigation buttons all render completely and cleanly.
    • The primary UI rendered properly upon loading http://localhost:3000/, displaying the 'WAITING FOR AGENT SESSION' prompt, session metrics in the header, and interactive dock buttons ('Review', 'Files', 'Chat', '$Cost', 'Timeline').

Issues

Findings that survived the Critic's audit. Security-class issues stay summary-only until the maintainers ship a fix.

mediumwithdrawnfunctionalF1 · S10

'$Cost' button in bottom dock is non-functional and does not toggle or display cost metrics

The scenario record explicitly states that clicking the '$Cost' button in the dock triggered no action or panel, unlike the other dock controls.

Expected

Clicking '$Cost' toggles the visibility of the token/cost metrics or displays a cost breakdown panel.

Actual

Clicking '$Cost' performs no action; the token/cost metric display remains unchanged and no panel or toggle state changes.

Repro · 3 steps
  1. Navigate to http://localhost:3000/
  2. Click the '$Cost' button located in the bottom dock
  3. Observe the token/cost metric display and UI state

Critic audit

An adversarial second pass over every finding before it reaches the report.

1
findings reviewed
0
re-verified live
1
withdrawn
  • F1withdrawn

    Checked against the source at the tested commit on 2026-09-19: the Cost button toggles a cost overlay that is drawn on the canvas (drawCostLabels and drawCostSummaryPanel). A canvas drawing has no DOM, so the test harness could not see the change. Not a defect.

  • The test suite successfully verified all other bottom dock panels and only found the $Cost button to be unresponsive.
  • F1 was withdrawn by hand after a check in a real browser: Checked against the source at the tested commit on 2026-09-19: the Cost button toggles a cost overlay that is drawn on the canvas (drawCostLabels and drawCostSummaryPanel). A canvas drawing has no DOM, so the test harness could not see the change. Not a defect.

Report

QA report: patoles/agent-flow at 84cd2fb

Core controls and dock panels operate smoothly across the application, but the '$Cost' button in the bottom dock is completely unresponsive.

Testing covered 12 deep feature scenarios across the application interface, including review mode, playback speed selection, transcript searching and filtering, dock panel toggling, and 404 resilience handling.

Eleven of the twelve scenarios passed without issue. The single failure occurred when interacting with the '$Cost' control in the bottom dock, where clicking the button produces no state change or cost metrics display.

Because core navigation, panel switching, and transcript filtering remain stable, this defect is isolated to cost visibility and does not impede the primary viewing workflow.

Run summary
MetricCount
Scenarios executed12
Passed11
Failed1
Blocked0
Findings raised1
Issues after the audit1
Withdrawn by the audit0
Critical / high / medium / low0 / 0 / 1 / 0

Target: http://localhost:3000 · Testing level: deep_feature · Stack: node / pnpm

Issues

No issues stood after the audit.

Withdrawn findings

The Critic re-examined these claims and found the evidence did not support them. They are kept here rather than deleted.

  • '$Cost' button in bottom dock is non-functional and does not toggle or display cost metrics (S10, medium): Checked against the source at the tested commit on 2026-09-19: the Cost button toggles a cost overlay that is drawn on the canvas (drawCostLabels and drawCostSummaryPanel). A canvas drawing has no DOM, so the test harness could not see the change. Not a defect.
Scenario results
ScenarioPriorityResultIssues
S1 Initial load and waiting statehighpassnone
S2 Review mode togglehighpassnone
S3 Chat transcript panel togglehighpassnone
S4 Files panel togglehighpassnone
S5 Timeline panel togglehighpassnone
S6 Playback speed selectionmediumpassnone
S7 Chat transcript search togglemediumpassnone
S8 Chat transcript filtering with textmediumpassnone
S9 Chat transcript filtering with whitespacemediumpassnone
S10 Cost metrics togglemediumfailF1
S11 Panel switching handlingmediumpassnone
S12 Load integrity and 404 resiliencelowpassnone
The audit

The Critic reviewed 1 finding and re-verified 0 of them live in the browser, replaying the reported steps on a fresh page.

  • The test suite successfully verified all other bottom dock panels and only found the $Cost button to be unresponsive.
What to fix first
  1. Fix the '$Cost' button handler in the bottom dock so that it toggles and displays the intended cost metrics panel (F1).
Coverage and caveats

In scope: Application empty/waiting state; Review mode and playback controls; Chat transcript panel and filtering; Files panel toggle; Timeline panel toggle; Cost metric display toggle; Panel transition handling.

Not covered: Live agent session injection; Actual websocket/streaming data testing.

  • The application will start in an empty state waiting for an agent session since no backend session is provided.
  • The 404 console error noted in the intake does not block the primary UI rendering.
  • Without real session data, filtering the chat transcript will yield zero results, which is a valid test for empty state handling.
By the numbers
MetricValue
Scenarios11 passed, 1 failed, 0 blocked of 12 (41 planned steps)
Browser actions130 (40 clicks, 4 inputs, 16 navigations, 70 snapshots)
Screenshots40 (4 explore, 36 scenario, 0 critic), 36 captioned
Coverage1 pages, 1 forms, 5 flows, 1 console errors
Audit1 findings, 0 re-verified live, 0 confirmed, 0 promoted, 1 withdrawn
Model calls139
Tokens467,616 input, 6,973 output, 7,958 thinking
Time5 min
StageCallsInputOutputThinkingSeconds
explore2167,4701,4701,07851
plan13,2601,9191,67228
test115390,8303,2463,902229
critique14,5901398889
report11,4661994186

Run log

stagecallstokenstime
Explore2170k51s
Plan16.9k28s
Test115398k3m 49s
Critique15.6k9s
Report12.1k6s
Total139482.5k5m 23s
Intake
Explore
Plan
Test
Critique
Report
  • 02:51:36Zexploreexplore started
  • 02:57:07ZexploreExplored / (6 controls, 0 forms)
  • 02:57:07ZexploreExplored /review (0 controls, 0 forms)
  • 02:57:07ZexploreMapped 1 pages, 1 forms, 5 flows in 21 turns.
  • 02:57:07Zexploreexplore completed in 51s.
  • 02:57:07Zplanplan started
  • 02:57:07ZplanPlanned 12 scenarios (5 high, 6 medium, 1 low).
  • 02:57:07Zplanplan completed in 28s.
  • 02:57:07Ztesttest started
  • 02:57:07ZtestS1 executed (pass)
  • 02:57:07ZtestS2 executed (pass)
  • 02:57:07ZtestS3 executed (pass)
  • 02:57:07ZtestS4 executed (pass)
  • 02:57:07ZtestS5 executed (pass)
  • 02:57:07ZtestS6 executed (pass)
  • 02:57:07ZtestS7 executed (pass)
  • 02:57:07ZtestS8 executed (pass)
  • 02:57:07ZtestS9 executed (pass)
  • 02:57:07ZtestS10 executed (fail), 1 finding
  • 02:57:07ZtestS11 executed (pass)
  • 02:57:07ZtestS12 executed (pass)
  • 02:57:07ZtestExecuted 12 scenarios: 11 passed, 1 failed, 0 blocked, 1 finding.
  • 02:57:07Ztesttest completed in 229s.
  • 02:57:07Zcritiquecritique started
  • 02:57:07ZcritiqueReviewed 1 findings; 0 possible defects spotted in passed scenarios.
  • 02:57:07ZcritiqueAudit complete: 1 confirmed, 0 withdrawn, 0 promoted, 0 re-verified live.
  • 02:57:07Zcritiquecritique completed in 9s.
  • 02:57:07Zreportreport started
  • 02:57:07ZreportReported 1 issue (0 critical, 0 high, 1 medium, 0 low) from 1 finding.
  • 02:57:07Zreportreport completed in 6s.

Put an agent team on your next pull request.

Connect a repo, dispatch a Run, and read an audited, evidence-backed report the same day.