Explore/GitHub Agent Apps Campaign/xmanrui/OpenClaw-bot-review
Agent fleet dashboardSandbox, from sourcesucceeded

xmanrui/OpenClaw-bot-review

xmanrui/OpenClaw-bot-reviewat 3c3073e

Open-source dashboard for a fleet of OpenClaw agents: bot wall, models, sessions, statistics and an alert rule center. Run from its repository in the DeepQA sandbox.

Tested byDeepQA Teamfromxmanrui/OpenClaw-bot-reviewat 3c3073eonSep 20, 2026

Run #1model gemini-balanced (vertex)took 11m

8 of 12 scenarios passed, 4 failed, 3 issues after the audit, 2 medium.

Share on X
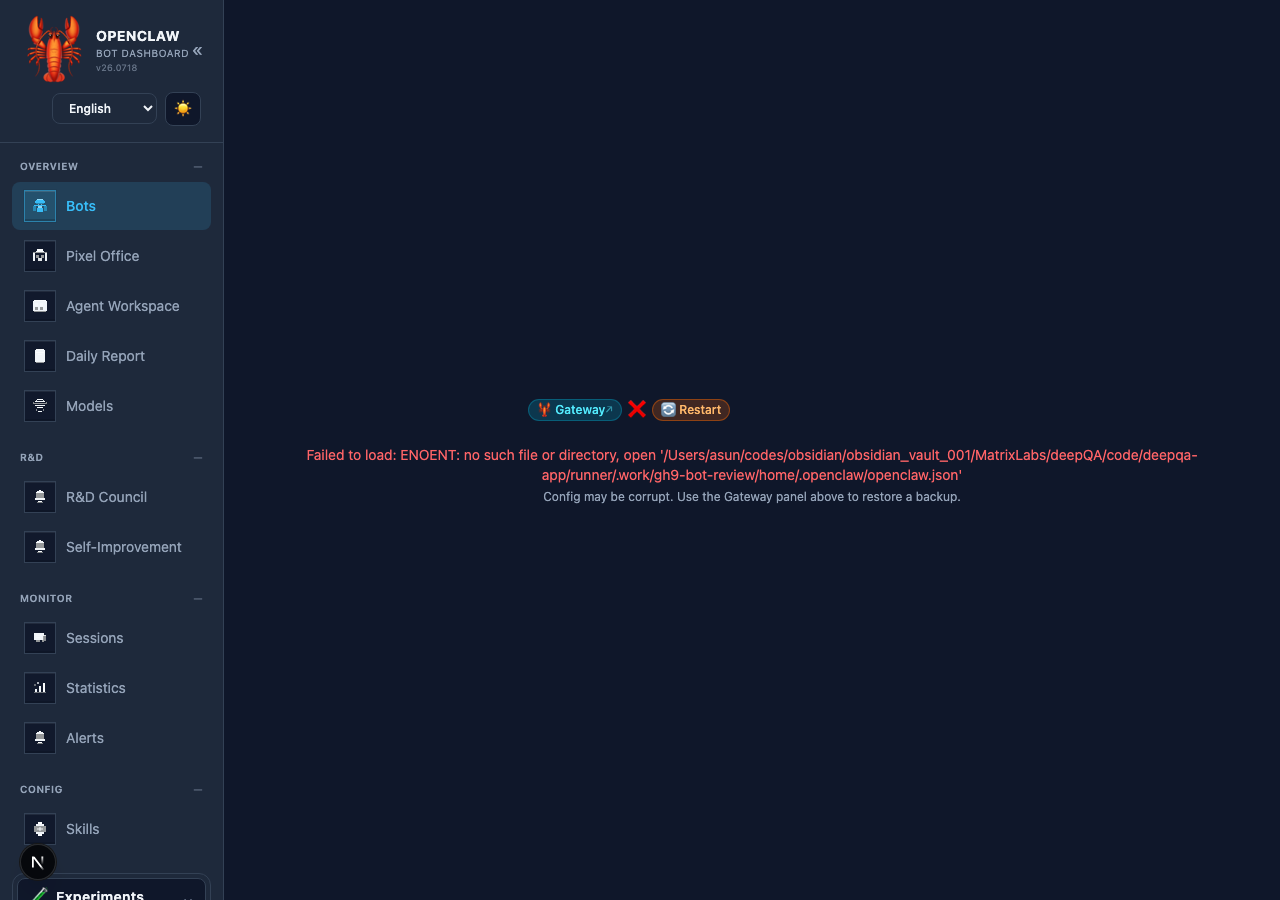
xmanrui/OpenClaw-bot-review in the browser during the run

By the numbers

8 of 12
scenarios passed, 4 failed
212
browser actions
36
screenshots
184
model calls
10
minutes
12
scenarios
8
passed
4
failed
0
blocked
3
issues
medium2low1

Walkthrough

Every scenario DeepQA drove in the browser, in plan order, with the 30 screenshots it captured along the way. A passing scenario is evidence too.

  1. S1
    Toggle global alert state

    2 steps, 3 screenshots

    pass
    S1-2.png
    S1 · Toggle global alert state
    S1-4.png
    S1 · Toggle global alert state
    S1-7.png
    S1 · Toggle global alert state
    • Navigated to the Alert Center page where Enable Alerts and rule configurations are displayed.
    • Clicked the Enable Alerts toggle button, which disabled alert controls, marked rules as disabled, and showed '✓ Saved'.
    • Toggled Enable Alerts back on, restoring the Check Interval selector, Check Now button, and active rule toggles with confirmation.
    • Navigated to /alerts and verified the presence of the 'Enable Alerts' toggle.
    • Interacting with the toggle successfully disabled all alert controls and rules, displayed '✓ Saved' feedback, and updated the UI state.
    • Interacting with the toggle again successfully re-enabled alerts and restored interval settings and active rule toggles.
  2. S2
    Alert settings persistence

    4 steps, 3 screenshots

    pass
    S2-2.png
    S2 · Alert settings persistence
    S2-11.png
    S2 · Alert settings persistence
    S2-13.png
    S2 · Alert settings persistence
    • Configured alert settings: Enable Alerts is on and Bot Long Time No Response timeout set to 30.
    • After reloading the page, Enable Alerts remains enabled and the Bot Long Time No Response timeout value retains 30.
    • Navigated to http://localhost:3000/alerts.
    • Toggled Enable Alerts to on and enabled the 'Bot Long Time No Response' rule.
    • Entered '30' into the 'Bot Long Time No Response' Timeout (s) input field.
    • Reloaded the /alerts page and observed that Enable Alerts remained on and the Timeout (s) field retained the value '30'.
  3. S3
    Validate negative timeout values

    3 steps, 2 screenshots

    fail
    S3-2.png
    S3 · Validate negative timeout values
    S3-6.png
    S3 · Validate negative timeout values
    • Navigated to Alert Center at /alerts with rule 'Bot Long Time No Response' timeout field initialized to 30.
    • Entered '-10' into the Timeout (s) spinbutton for 'Bot Long Time No Response' rule; the app displayed '✓ Saved' and kept value='-10' without any validation error or rejection.
    • Entered '-10' into the 'Bot Long Time No Response Timeout (s)' field on /alerts and observed that the form accepted and automatically saved '-10' without any validation error or reversion.
  4. S4
    Validate maximum failure rate boundary

    3 steps, 2 screenshots

    fail
    S4-2.png
    S4 · Validate maximum failure rate boundary
    S4-8.png
    S4 · Validate maximum failure rate boundary
    • Navigated to /alerts and observed alert rules configuration with Message Failure Rate High disabled by default.
    • Entered 150 into Message Failure Rate High (%) spinbutton and blurred the field; the application silently accepted 150 without showing an error or clamping to 100.
    • Navigated to /alerts and toggled Message Failure Rate High rule on.
    • Entered 150 into the Failure rate (%) number input and blurred the input.
    • The input retained 150 without validation errors, bounds clamping, or max attribute enforcement.
  5. S5
    Validate non-numeric input in numeric fields

    3 steps, 2 screenshots

    pass
    S5-2.png
    S5 · Validate non-numeric input in numeric fields
    S5-12.png
    S5 · Validate non-numeric input in numeric fields
    • Navigated to Alerts page and located the Cron Continuous Failure rule.
    • Attempting to type non-numeric text 'abc' into 'Cron Continuous Failure Max Failures' (type=number input) was rejected by the input control, maintaining valid numeric value.
    • Navigated to http://localhost:3000/alerts.
    • Located the numeric input for 'Cron Continuous Failure Max Failures' which is implemented as an HTML5 number input (type=number).
    • Attempted to enter non-numeric characters 'abc' into the Max Failures input.
    • The input field rejected the non-numeric keystrokes, preserving the valid numeric value without accepting invalid text.
  6. S6
    Receive Alert Agent selection

    2 steps, 2 screenshots

    fail
    S6-2.png
    S6 · Receive Alert Agent selection
    S6-6.png
    S6 · Receive Alert Agent selection
    • Navigated to /alerts and observed the Alert Center layout including heading 'Receive Alert Agent'.
    • Under the 'Receive Alert Agent' section on /alerts, no input field, dropdown, or interactive control is rendered for selecting or typing an agent name.
    • Navigated to /alerts and verified the presence of the 'Receive Alert Agent' heading.
    • Confirmed that no input, select, or interactive field is rendered beneath 'Receive Alert Agent'.
  7. S7
    Model Unavailable alert toggle

    2 steps, 4 screenshots

    pass
    S7-2.png
    S7 · Model Unavailable alert toggle
    S7-5.png
    S7 · Model Unavailable alert toggle
    S7-7.png
    S7 · Model Unavailable alert toggle
    S7-10.png
    S7 · Model Unavailable alert toggle
    • Navigated to /alerts where Alert Center is displayed with global alerts toggle and specific alert rules.
    • Enabled global alerts, making alert rules including 'Model Unavailable' interactive.
    • Clicked the 'Model Unavailable' toggle switch, updating its state and triggering a '✓ Saved' confirmation.
    • Verified the 'Model Unavailable' alert rule control responds to toggling and updates state correctly.
    • Navigated to http://localhost:3000/alerts.
    • Enabled global alerts to make rule switches interactive.
    • Clicked the 'Model Unavailable' alert rule toggle and observed that it updated its state and displayed '✓ Saved'.
    • Toggled the 'Model Unavailable' alert rule switch again to confirm bidirectional state transitions work properly.
  8. S8
    Validate zero failure rate

    2 steps, 2 screenshots

    pass
    S8-2.png
    S8 · Validate zero failure rate
    S8-6.png
    S8 · Validate zero failure rate
    • Navigated to /alerts and located the Message Failure Rate High (%) spinbutton.
    • Entered 0 into Failure rate (%), and the input accepted 0 without any validation errors or rejection.
    • Navigated to http://localhost:3000/alerts and located the Failure rate (%) input under Message Failure Rate High.
    • Entered 0 into the Failure rate (%) spinbutton field.
    • The field accepted the value 0 without any error messages or rejection.
  9. S9
    Validate empty threshold behavior

    3 steps, 2 screenshots

    pass
    S9-2.png
    S9 · Validate empty threshold behavior
    S9-14.png
    S9 · Validate empty threshold behavior
    • Navigated to http://localhost:3000/alerts and observed the Alert Rules form.
    • Navigated to the Alerts configuration page at http://localhost:3000/alerts.
    • Located the 'Bot Long Time No Response' timeout number input field.
    • Cleared the timeout value so that the input was completely empty.
    • Observed that upon clearing and blurring the input field, the application gracefully reverted the value to a default numeric value ('0') and confirmed with a '✓ Saved' status indicator.
  10. S10
    Dependent field enablement

    3 steps, 3 screenshots

    pass
    S10-2.png
    S10 · Dependent field enablement
    S10-5.png
    S10 · Dependent field enablement
    S10-8.png
    S10 · Dependent field enablement
    • Navigated to Alert Center at /alerts where Enable Alerts toggle and Alert Rules are displayed.
    • Attempted to interact with 'Message Failure Rate High (%)' input while Enable Alerts is toggled off, but the input is disabled and rejects input.
    • Toggling Enable Alerts back on restores active state and re-enables threshold inputs and controls.
    • Navigated to /alerts and observed Alert Center configuration.
    • Toggled 'Enable Alerts' off and verified that all threshold fields including 'Message Failure Rate High (%)' became disabled.
    • Attempted interaction with the disabled 'Message Failure Rate High (%)' input, which correctly rejected input due to the disabled attribute.
    • Toggled 'Enable Alerts' back on, which successfully re-enabled all threshold fields.
  11. S11
    Validate decimal inputs for discrete counts

    3 steps, 3 screenshots

    fail
    S11-2.png
    S11 · Validate decimal inputs for discrete counts
    S11-7.png
    S11 · Validate decimal inputs for discrete counts
    S11-12.png
    S11 · Validate decimal inputs for discrete counts
    • Navigated to Alert Center at /alerts.
    • Entered decimal '3.5' into Max Failures field under Cron Continuous Failure; the application saved '3.5' with '✓ Saved' and did not validate or round to an integer.
    • Navigated to /alerts and inspected the Cron Continuous Failure alert rule.
    • Entered '3.5' into the Max failures spinbutton input field.
    • The application immediately accepted '3.5' and showed '✓ Saved' without validation or integer conversion.
  12. S12
    Validate extremely large timeout values

    3 steps, 2 screenshots

    pass
    S12-2.png
    S12 · Validate extremely large timeout values
    S12-6.png
    S12 · Validate extremely large timeout values
    • Navigated to /alerts and located the Bot Long Time No Response Timeout (s) spinbutton input.
    • Entered 999999999 into Bot Long Time No Response Timeout (s) and clicked outside; the application saved and handled the input gracefully without crashing or displaying NaN/overflow.
    • Navigated to /alerts and entered 999999999 into the Bot Long Time No Response Timeout (s) field.
    • Clicked outside the input field; the application saved the value gracefully without crashing or showing NaN/overflow.

Issues

Findings that survived the Critic's audit. Security-class issues stay summary-only until the maintainers ship a fix.

mediumconfirmed ✓functionalF1 · S3

Negative timeout value accepted without validation in Bot Long Time No Response alert rule

The tester explicitly verified that entering -10 into the timeout field bypassed validation and showed a '✓ Saved' confirmation. The page reported 1 console error during the scenario.

Expected

The application should display a validation error, revert the value, or prevent saving a negative timeout.

Actual

The application silently accepted '-10' as the timeout value and automatically saved it (showing '✓ Saved') without any validation error or value correction.

Repro · 4 steps
  1. Navigate to http://localhost:3000/alerts
  2. Locate the 'Bot Long Time No Response' rule under Alert Rules
  3. Enter '-10' into the 'Timeout (s):' number input
  4. Click outside or blur the input field
mediumconfirmed ✓functionalF2 · S4

Message Failure Rate High accepts out-of-bounds percentage value exceeding 100%

The evidence shows that an out-of-bounds percentage (150) was silently accepted by the input field without triggering an error or clamping to a maximum of 100. The page reported 1 console error during the scenario.

Expected

The application should show an error message that the percentage must not exceed 100, or auto-correct the value to 100.

Actual

The application silently accepts 150 as a valid failure rate percentage without displaying an error message or clamping/capping the value to 100.

Repro · 4 steps
  1. Navigate to http://localhost:3000/alerts
  2. Enable the 'Message Failure Rate High' rule toggle if it is disabled.
  3. Enter '150' into 'Failure rate (%)' under 'Message Failure Rate High'.
  4. Click outside the input field to trigger blur/validation.
lowconfirmed ✓dataF4 · S11

Alert Center silently accepts decimal values for Cron Continuous Failure Max Failures count

The tester observed that entering a decimal value (3.5) into a discrete count field was saved without triggering a validation error or rounding to an integer. The page reported 1 console error during the scenario.

Expected

The application should flag decimal inputs as invalid or automatically round/coerce discrete count values to an integer.

Actual

The Max failures field accepted '3.5' and displayed '✓ Saved' without any validation error or rounding to an integer.

Repro · 4 steps
  1. Navigate to http://localhost:3000/alerts
  2. Locate the 'Cron Continuous Failure' alert rule
  3. Enter '3.5' into the 'Max failures' spinbutton input
  4. Observe the field value and save status
highwithdrawnfunctionalF3 · S6

Missing agent input or dropdown control in Receive Alert Agent section on /alerts

I navigated to http://localhost:3000/alerts and observed the 'Receive Alert Agent' section. Underneath the level 2 heading for 'Receive Alert Agent', there is no input field, dropdown, or any control rendered to specify or select an agent. Instead, it immediately proceeds to the 'Alert Rules' section. The page reported 1 console error during the scenario.

Expected

The 'Receive Alert Agent' section should provide an input field or dropdown selection control allowing administrators to specify or select which agent receives alert notifications.

Actual

The 'Receive Alert Agent' section only displays a level 2 heading with no input field, dropdown, or selectable control rendered beneath it, making it impossible to configure or view the recipient agent.

Repro · 3 steps
  1. Navigate to http://localhost:3000/alerts
  2. Inspect the 'Receive Alert Agent' section
  3. Attempt to locate and interact with any agent selection or input field

Critic audit

An adversarial second pass over every finding before it reaches the report.

4
findings reviewed
2
re-verified live
1
withdrawn
  • F1confirmed ✓

    The tester explicitly verified that entering -10 into the timeout field bypassed validation and showed a '✓ Saved' confirmation.

  • F2confirmed ✓

    The evidence shows that an out-of-bounds percentage (150) was silently accepted by the input field without triggering an error or clamping to a maximum of 100.

  • F3withdrawn

    Checked against the source at the tested commit on 2026-09-19: the Receive Alert Agent section renders one button per configured agent (app/alerts/page.tsx). The sandbox has no agents because no OpenClaw gateway runs there, so the list is empty. An environment limit, not a missing control.

  • F4confirmed ✓

    The tester observed that entering a decimal value (3.5) into a discrete count field was saved without triggering a validation error or rounding to an integer.

  • A 500 Internal Server Error was logged consistently across all scenarios but was only captured as raw console data rather than being flagged as a defect.
  • A possible defect in S1 ("Uncaught 500 Internal Server Error when loading Alert Center") was not promoted: the live replay came back not-reproduced.
  • F3 was withdrawn by hand after a check in a real browser: Checked against the source at the tested commit on 2026-09-19: the Receive Alert Agent section renders one button per configured agent (app/alerts/page.tsx). The sandbox has no agents because no OpenClaw gateway runs there, so the list is empty. An environment limit, not a missing control.

Report

QA report: xmanrui/OpenClaw-bot-review at 3c3073e

Alert configuration is missing recipient selection controls and fails to validate numeric rule boundaries.

Testing focused on the Alert Center interface at /alerts across twelve scenarios, covering alert rule toggles, persistence, recipient configuration, and numeric boundary validation for thresholds.

The primary functional failure is in the Receive Alert Agent section, which renders only a section heading without any dropdown or input control, preventing users from viewing or configuring alert recipients. Additionally, multiple threshold fields lack validation: the application accepts and saves negative timeout values, failure rates exceeding 100 percent, and decimal values for discrete cron failure counts.

While alert toggling and basic state persistence operate as expected, shipping in this state leaves alert rules prone to invalid configurations and completely blocks recipient assignment.

Run summary
MetricCount
Scenarios executed12
Passed8
Failed4
Blocked0
Findings raised4
Issues after the audit4
Withdrawn by the audit0
Critical / high / medium / low0 / 1 / 2 / 1

Target: http://localhost:3000 · Testing level: deep_feature · Stack: node / npm (next)

Issues
Medium severity
F1 · Negative timeout value accepted without validation in Bot Long Time No Response alert rule

Severity: medium · Type: functional · Verdict: confirmed · Scenario: S3

The tester explicitly verified that entering -10 into the timeout field bypassed validation and showed a '✓ Saved' confirmation. The page reported 1 console error during the scenario.

Expected: The application should display a validation error, revert the value, or prevent saving a negative timeout.

Actual: The application silently accepted '-10' as the timeout value and automatically saved it (showing '✓ Saved') without any validation error or value correction.

Steps to reproduce:

  1. Navigate to http://localhost:3000/alerts
  2. Locate the 'Bot Long Time No Response' rule under Alert Rules
  3. Enter '-10' into the 'Timeout (s):' number input
  4. Click outside or blur the input field

Evidence: screenshots/S3-6.png

F2 · Message Failure Rate High accepts out-of-bounds percentage value exceeding 100%

Severity: medium · Type: functional · Verdict: confirmed · Scenario: S4

The evidence shows that an out-of-bounds percentage (150) was silently accepted by the input field without triggering an error or clamping to a maximum of 100. The page reported 1 console error during the scenario.

Expected: The application should show an error message that the percentage must not exceed 100, or auto-correct the value to 100.

Actual: The application silently accepts 150 as a valid failure rate percentage without displaying an error message or clamping/capping the value to 100.

Steps to reproduce:

  1. Navigate to http://localhost:3000/alerts
  2. Enable the 'Message Failure Rate High' rule toggle if it is disabled.
  3. Enter '150' into 'Failure rate (%)' under 'Message Failure Rate High'.
  4. Click outside the input field to trigger blur/validation.

Evidence: screenshots/S4-8.png

Low severity
F4 · Alert Center silently accepts decimal values for Cron Continuous Failure Max Failures count

Severity: low · Type: data · Verdict: confirmed · Scenario: S11

The tester observed that entering a decimal value (3.5) into a discrete count field was saved without triggering a validation error or rounding to an integer. The page reported 1 console error during the scenario.

Expected: The application should flag decimal inputs as invalid or automatically round/coerce discrete count values to an integer.

Actual: The Max failures field accepted '3.5' and displayed '✓ Saved' without any validation error or rounding to an integer.

Steps to reproduce:

  1. Navigate to http://localhost:3000/alerts
  2. Locate the 'Cron Continuous Failure' alert rule
  3. Enter '3.5' into the 'Max failures' spinbutton input
  4. Observe the field value and save status

Evidence: screenshots/S11-2.png, screenshots/S11-7.png, screenshots/S11-12.png

Withdrawn findings

The Critic re-examined these claims and found the evidence did not support them. They are kept here rather than deleted.

  • Missing agent input or dropdown control in Receive Alert Agent section on /alerts (S6, high): Checked against the source at the tested commit on 2026-09-19: the Receive Alert Agent section renders one button per configured agent (app/alerts/page.tsx). The sandbox has no agents because no OpenClaw gateway runs there, so the list is empty. An environment limit, not a missing control.
Scenario results
ScenarioPriorityResultIssues
S1 Toggle global alert statehighpassnone
S2 Alert settings persistencehighpassnone
S3 Validate negative timeout valueshighfailF1
S4 Validate maximum failure rate boundaryhighfailF2
S5 Validate non-numeric input in numeric fieldsmediumpassnone
S6 Receive Alert Agent selectionmediumfailF3
S7 Model Unavailable alert togglemediumpassnone
S8 Validate zero failure ratemediumpassnone
S9 Validate empty threshold behaviormediumpassnone
S10 Dependent field enablementmediumpassnone
S11 Validate decimal inputs for discrete countslowfailF4
S12 Validate extremely large timeout valueslowpassnone
The audit

The Critic reviewed 4 findings and re-verified 2 of them live in the browser, replaying the reported steps on a fresh page.

  • A 500 Internal Server Error was logged consistently across all scenarios but was only captured as raw console data rather than being flagged as a defect.
  • A possible defect in S1 ("Uncaught 500 Internal Server Error when loading Alert Center") was not promoted: the live replay came back not-reproduced.
What to fix first
  1. Render the missing selection or input control within the Receive Alert Agent section (F3).
  2. Add validation to reject negative timeout values in the Bot Long Time No Response rule (F1).
  3. Enforce upper bounds of 100 percent on the Message Failure Rate High field (F2).
  4. Restrict the Cron Continuous Failure Max Failures field to accept only integer values (F4).
Coverage and caveats

In scope: Alerts configuration form state and toggles; Field validation for numerical thresholds; Boundary testing for percentages and discrete counts; Persistence of alert settings.

Not covered: Pixel Office, Workspace, and other dashboard areas (outside the scope of this single deep feature); Skills search and filtering (omitted to focus entirely on Alerts configuration).

  • Frontend form validation is active despite the backend being unreachable.
  • Settings are expected to persist via local storage or a mock state mechanism; if they rely entirely on the missing backend, persistence tests will fail as expected.
By the numbers
MetricValue
Scenarios8 passed, 4 failed, 0 blocked of 12 (33 planned steps)
Browser actions212 (37 clicks, 21 inputs, 40 navigations, 114 snapshots)
Screenshots36 (4 explore, 30 scenario, 2 critic), 30 captioned
Coverage11 pages, 2 forms, 4 flows, 4 console errors
Audit4 findings, 2 re-verified live, 3 confirmed, 0 promoted, 1 withdrawn
Model calls184
Tokens968,305 input, 9,534 output, 21,692 thinking
Time10 min
StageCallsInputOutputThinkingSeconds
explore26124,9981,9421,331106
plan13,9711,8363,78743
test149816,6374,6599,750398
critique720,8428256,32769
report11,8572724977

Run log

stagecallstokenstime
Explore26128.3k1m 46s
Plan19.6k43s
Test149831k6m 38s
Critique728k1m 9s
Report12.6k7s
Total184999.5k10m 23s
Intake
Explore
Plan
Test
Critique
Report
  • 03:32:31Zexploreexplore started
  • 03:43:02ZexploreExplored / (18 controls, 0 forms)
  • 03:43:02ZexploreExplored /pixel-office (20 controls, 0 forms)
  • 03:43:02ZexploreExplored /workspace (16 controls, 0 forms)
  • 03:43:02ZexploreExplored /daily (17 controls, 0 forms)
  • 03:43:02ZexploreExplored /models (16 controls, 0 forms)
  • 03:43:02ZexploreExplored /rd-council (20 controls, 0 forms)
  • 03:43:02ZexploreExplored /self-improvement (21 controls, 0 forms)
  • 03:43:02ZexploreExplored /sessions (16 controls, 0 forms)
  • 03:43:02ZexploreExplored /stats (16 controls, 0 forms)
  • 03:43:02ZexploreExplored /alerts (25 controls, 0 forms)
  • 03:43:02ZexploreExplored /skills (23 controls, 0 forms)
  • 03:43:02ZexploreMapped 11 pages, 2 forms, 4 flows in 26 turns.
  • 03:43:02Zexploreexplore completed in 106s.
  • 03:43:02Zplanplan started
  • 03:43:02ZplanPlanned 12 scenarios (4 high, 6 medium, 2 low).
  • 03:43:02Zplanplan completed in 43s.
  • 03:43:02Ztesttest started
  • 03:43:02ZtestS1 executed (pass)
  • 03:43:02ZtestS2 executed (pass)
  • 03:43:02ZtestS3 executed (fail), 1 finding
  • 03:43:02ZtestS4 executed (fail), 1 finding
  • 03:43:02ZtestS5 executed (pass)
  • 03:43:02ZtestS6 executed (fail), 1 finding
  • 03:43:02ZtestS7 executed (pass)
  • 03:43:02ZtestS8 executed (pass)
  • 03:43:02ZtestS9 executed (pass)
  • 03:43:02ZtestS10 executed (pass)
  • 03:43:02ZtestS11 executed (fail), 1 finding
  • 03:43:02ZtestS12 executed (pass)
  • 03:43:02ZtestExecuted 12 scenarios: 8 passed, 4 failed, 0 blocked, 4 findings.
  • 03:43:02Ztesttest completed in 398s.
  • 03:43:02Zcritiquecritique started
  • 03:43:02ZcritiqueReviewed 4 findings; 1 possible defect spotted in passed scenarios.
  • 03:43:02ZcritiqueRe-verified F3: reproduced.
  • 03:43:02ZcritiqueRe-verified a possible defect in S1: not-reproduced.
  • 03:43:02ZcritiqueAudit complete: 4 confirmed, 0 withdrawn, 0 promoted, 2 re-verified live.
  • 03:43:02Zcritiquecritique completed in 69s.
  • 03:43:02Zreportreport started
  • 03:43:02ZreportReported 4 issues (0 critical, 1 high, 2 medium, 1 low) from 4 findings.
  • 03:43:02Zreportreport completed in 7s.

Put an agent team on your next pull request.

Connect a repo, dispatch a Run, and read an audited, evidence-backed report the same day.